

Measure what matters
Moving beyond gaps, grades and botched cookie recipes


I’m not a baker.
If you’re looking for a baking blog then move on!
Despite my love for precision and curiosity, especially when it comes to tackling inequality, my culinary skills leave much to be desired.
Take, for example, the time I tried to bake 30 cookies to surprise my wife. What followed was quite literally bitter-sweet. Instead of 30 delicate, bite-sized cookies, I ended up with six hefty, three-course meal-sized cookies. They were tasty, yes, but something went awry in the execution. Each one was practically a meal in itself!
Measurement matters.
This is especially so when it comes to understanding and addressing educational inequality. If we fail to effectively understand problems - if we don’t approach it with the same forensic attention to detail that a decent recipe demands — we risk crafting a system that not only doesn’t work but could further entrench the barriers to learning that children and young people face, especially in schools.
Impact insights
Recently, I had the privilege of spending more time with colleagues at the Fair Education Alliance (FEA) and fellow Innovation Award winners, and we spent some valuable time reflecting on the topic of impact.
In the educational sphere, ‘impact’ is an overused term.
Of course it’s important, but too often, conversations about impact get boiled down to one thing: numbers. ‘The more green cells on a spreadsheet, the better,’ the logic seems to go. While I’m all for evidence-driven work, the conversation shouldn’t stop there. After all, we’re talking about children and young people, not figures on a chart.
I appreciate that educators serve in a system that is obsessed with numerical impact. Leaders and educators are held to account for the numerical outcomes that they are able to support children in getting. Needless to say, it serves some value being able to quantify some of this as impact. For example, the result of an intervention to boost attendance in school is clearly going to need a % based tagline somewhere.
The best educators I know aren’t motivated by performance reviews or external pressures — they want children and young people to succeed because they believe that outcomes in the broader sense matter.
And they should.
Evidence consistently shows that good academic outcomes translate into better life chances for young people. Whether we like it or not, the grades a school student receives can open doors (or close them) in ways that affect their entire future.
But, outcomes are far more than the grades a student receives on results day.
Sweaty envelopes…
I’ll give you a personal example.
Pictured is the envelope that contained my A-Level grades.

As I nervously peeled open that envelope, I could see the letters of each grade emerging. A blend of excitement and anxiety.
At first glance, the grades look average, maybe even mediocre.
But take a closer look at those sweaty fingerprint marks on the envelope. That was me, a lad from Lancashire, anxiously waiting to see if I’d made the grade to become the first person in my family to go to university.
Those grades were more than just numbers. They were the key to my future.
They determined whether I would get into Durham University and, by extension, whether my life would take a different path. They were the key to a life-changing opportunity, and while I don’t define myself by them now, they absolutely had an impact on my trajectory.
Spoiler alert — I did get the grades, and I did become an honorary Geordie (that wasn’t the degree course…) as the trajectory led me to make the North East my home
Mind the Gap (but don’t just measure it)
Grades, then, are only one part of outcomes.
For students from disadvantaged backgrounds, we need to think beyond those numbers and consider a wider understanding of what success means.
I’m reminded of how the Fair Education Alliance take a nuanced view of impact that moves beyond the simple numerical measures often favoured in policy circles. In fact, they are relentless about being curious too. Currently, the FEA are facilitating a range of workshops with member organisations to sharpen and shape their strategy to both understand and tackle educational inequality.
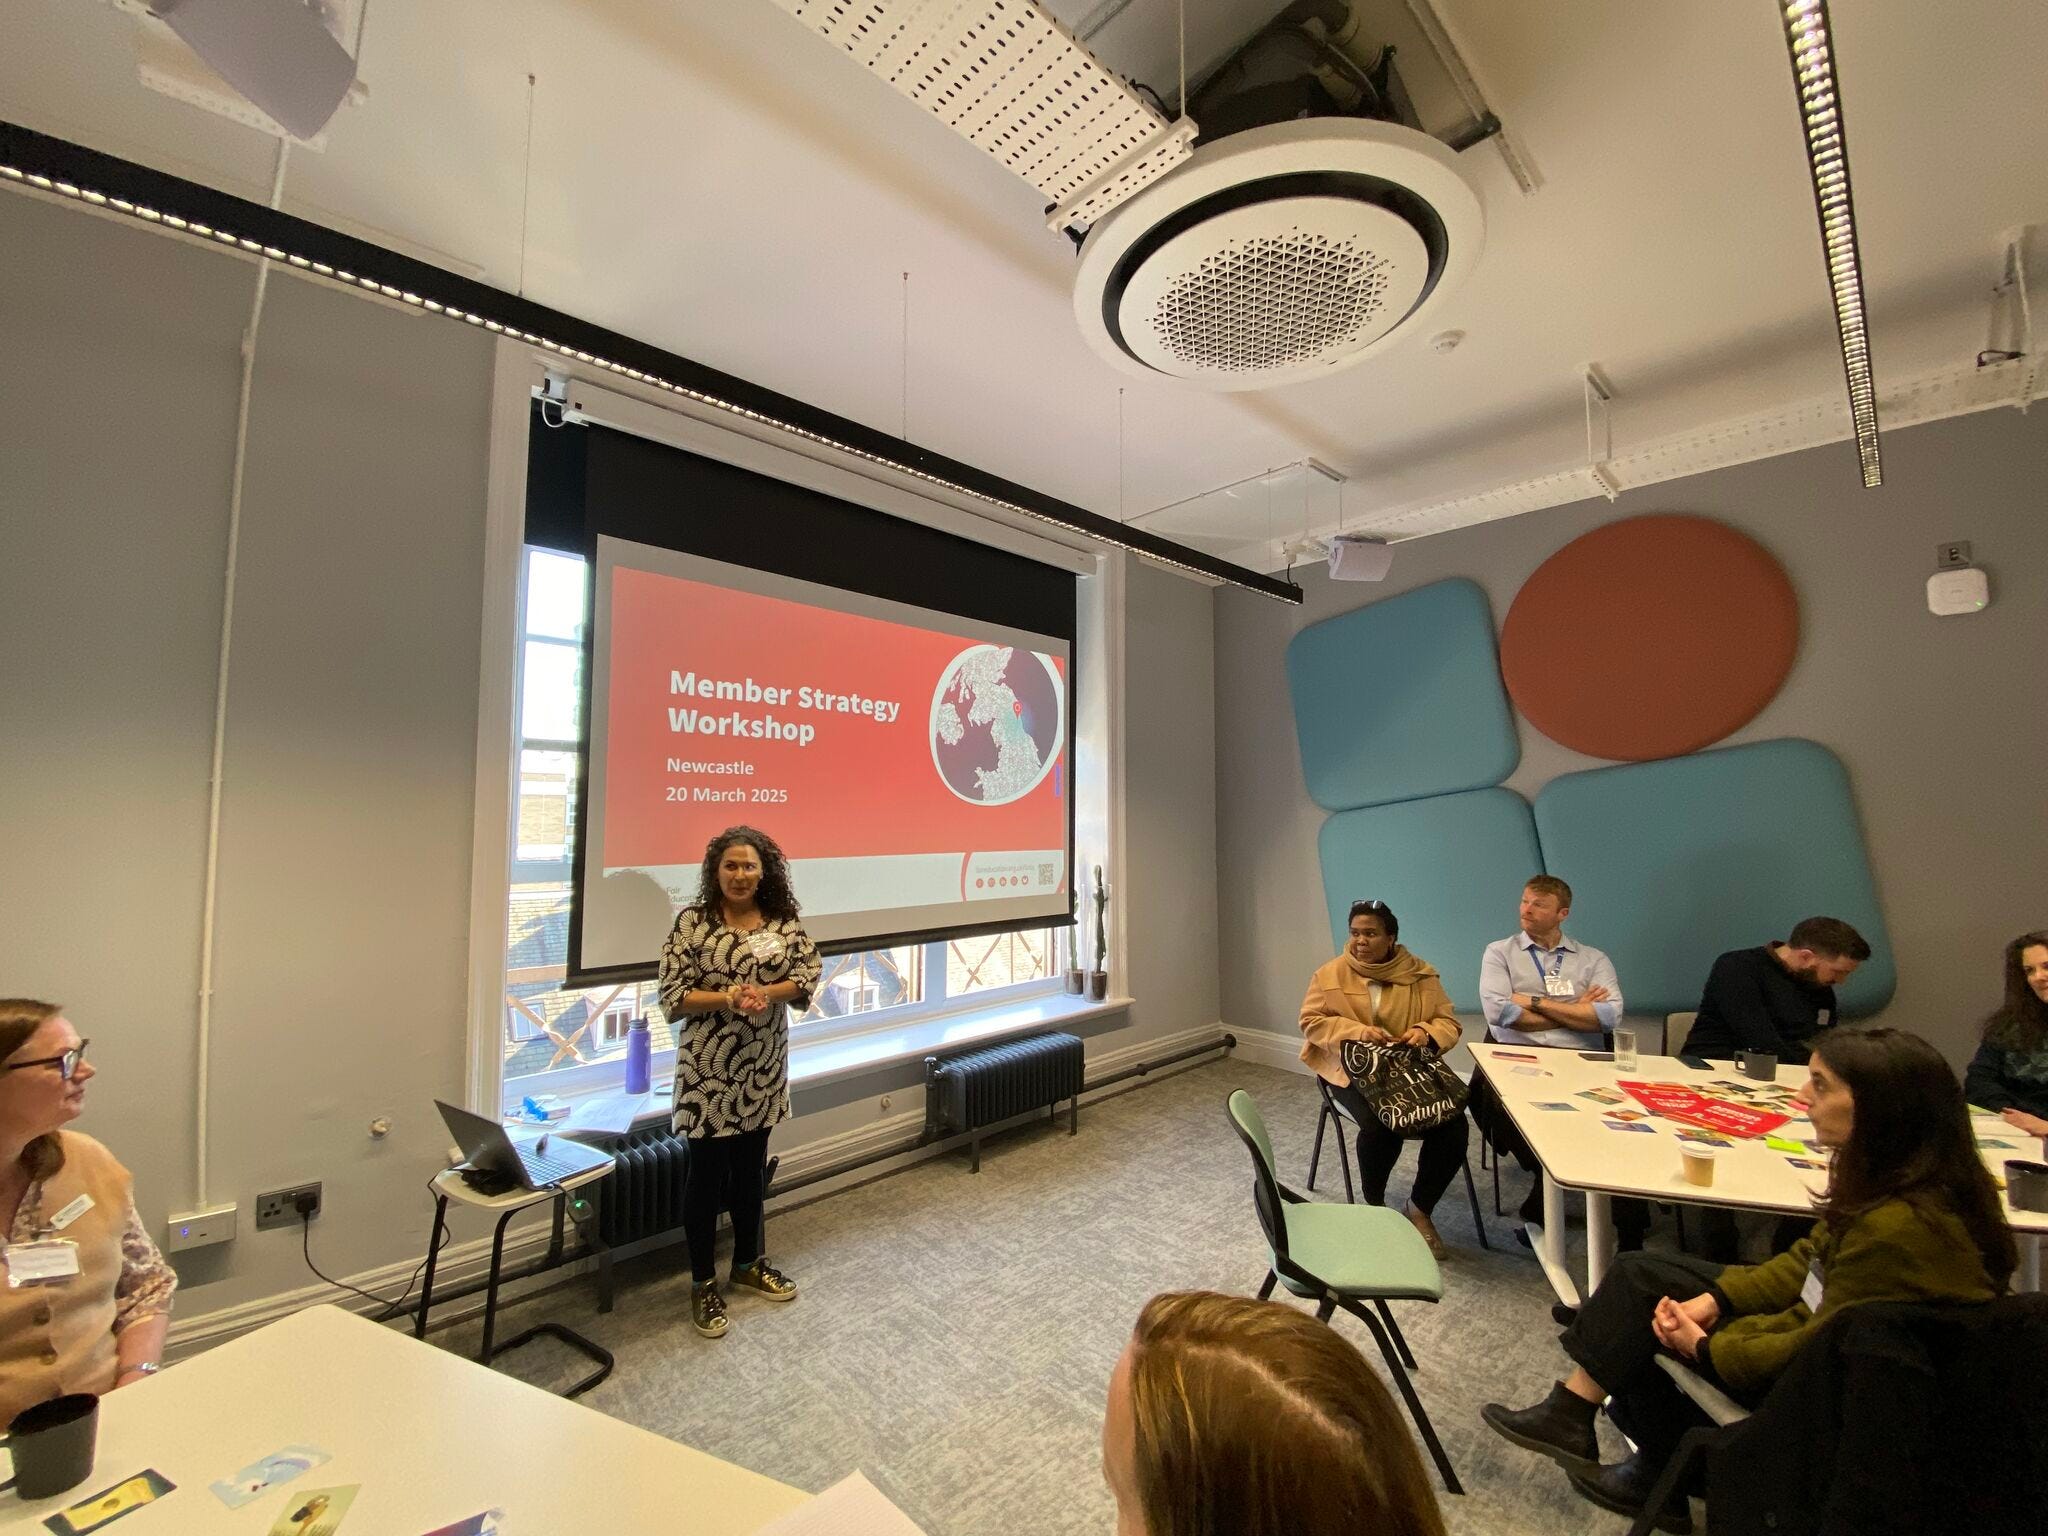
The FEA impact report is a brilliant example of how qualitative and quantitative data can come together to paint a fuller picture of educational outcomes and the far-reaching effects of policies on both practice and policy.

If you’ve ever taken the Underground in London, you’ll be familiar with the announcer’s voice telling you to ‘mind the gap’. You can easily become complacent and ignore it, but his words are there for a reason — to keep your eyes open, to encourage you to take notice of one part of the journey that is important.
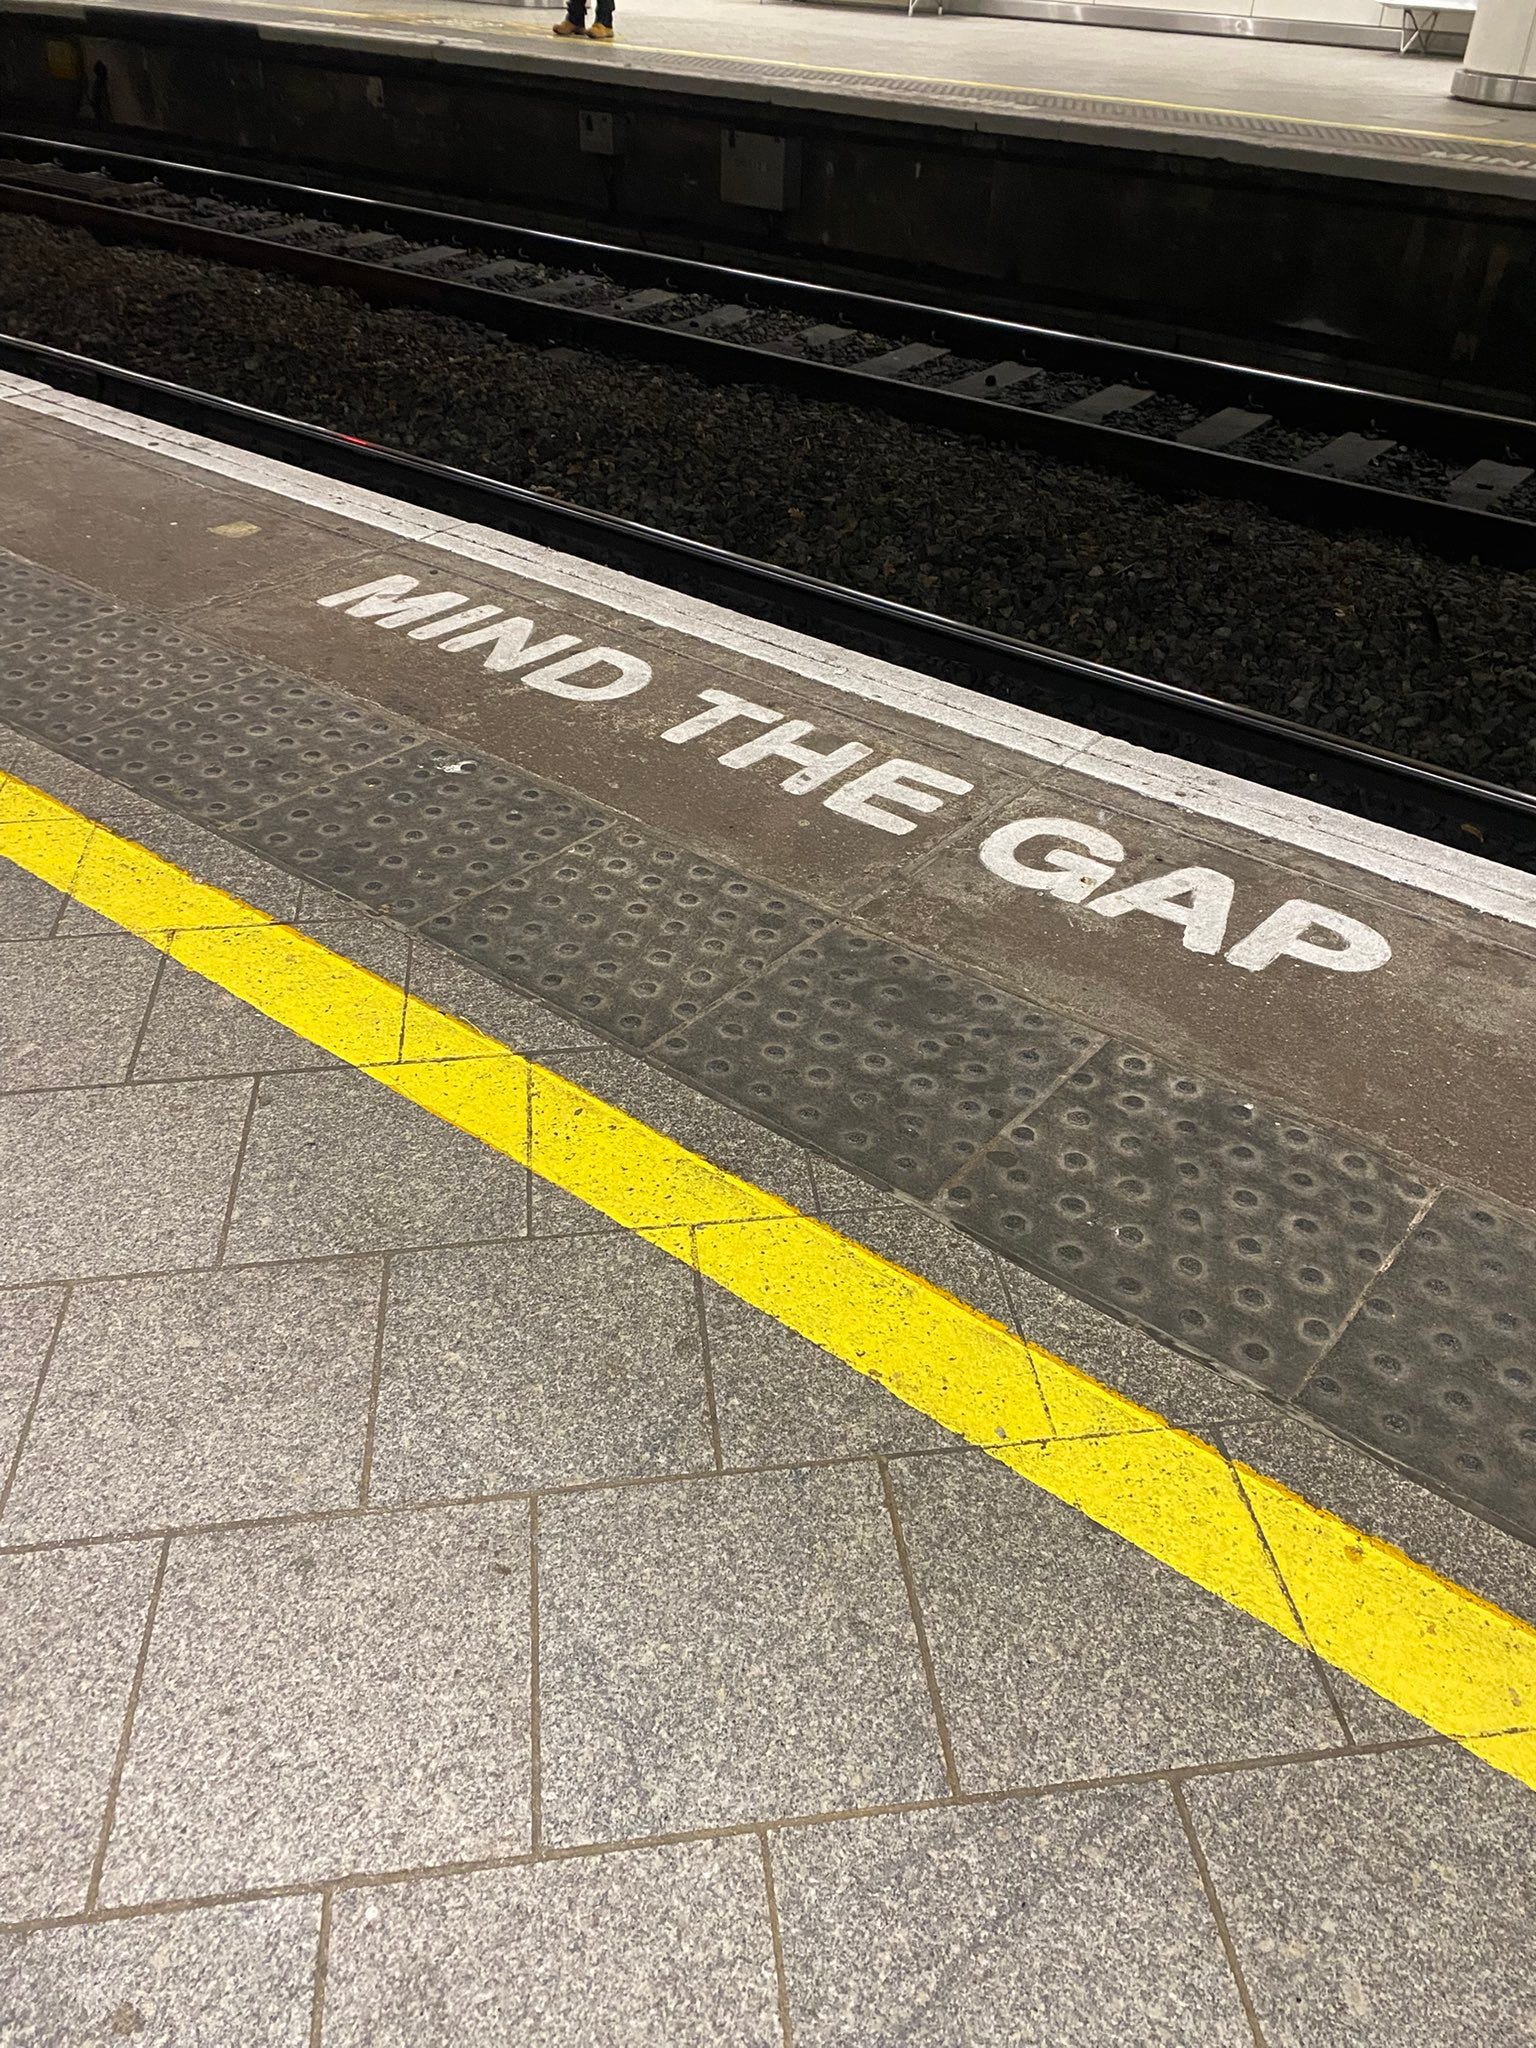
Being mindful of the gap is one component part of being a safe Tube traveller!
It’s the same with gaps in education.
Of course we need to keep an eye on the attainment gaps between disadvantaged and non-disadvantaged students, but we mustn’t let this narrow focus limit our more forensic understanding of inequality and what to do about it.
In a recent SecEd and Headteacher Update article, I highlighted the risks of reducing disadvantage to mere gaps in attainment. For decades, policymakers have obsessed over ‘closing the gap’ between disadvantaged and non-disadvantaged students, often and arguably unintentionally framing it as a standalone recipe for addressing inequality.
This approach has its flaws. We need a more forensic view of the barriers these students face. Simply focusing on the attainment gap gives us a one-dimensional view of the problem.
Jude Hillary, Head of Education Systems at the National Foundation for Education Research (NFER), has pointed out that the way we calculate these gaps is problematic. The use of ranked approaches — comparing the relative performance of disadvantaged and non-disadvantaged students — makes year-on-year comparisons unreliable.
Disadvantage gaps and measurements around them are sensitive to changes in the composition of the disadvantaged group. This includes factors like the rise in the number of Free School Meal (FSM)-eligible students due to the pandemic, the cost-of-living crisis, and changes to Universal Credit eligibility. These shifts make it difficult to discern whether the gap is closing because of policy success or because the disadvantaged group is becoming more diverse.
Researchers like Gorard (2022) and Cribb et al. (2023) have pointed out that looking at these gaps without considering broader contextual factors is misleading. We need a deeper understanding of why these gaps exist and how to address them.
The focus on attainment alone, while important, is not enough.
Doorstep Disadvantage
In Tackling Poverty and Disadvantage in Schools (TPADIS), my co-authors and I stress the importance of understanding the communities we serve.
We purposefully avoided getting bogged down in debates over terminology like ‘disadvantage’. I appreciate that the term is problematic. There are no clean or simple terms to use that are not riddled with some negative connotation or risk of putting labels on children and young people. Given that the persistent problem of inequality is already complex for schools, we argue that it’s more important for school leaders and educators to be clear about what they mean when they refer to disadvantage in their own contexts.
I’ve also written before about the concept of ‘doorstep disadvantage’. This term doesn’t refer to the literal doorstep of a house but to the nuanced barriers to learning that exist within communities. It’s about recognising that schools must take a contextual approach to understanding the specific challenges their students face. Numbers and gaps form a part of this picture, but this is one component.
In the opening chapter of TPADIS, we highlight the need for a framework and mindset that allows educators to better understand inequality in their own schools and communities. This isn't about expecting educators to solve these issues in isolation. Instead, we argue that collaboration with community organisations, charities, and industry leaders is key to understanding the full scope of disadvantage. Making use of official government statistics again is a component part of this.
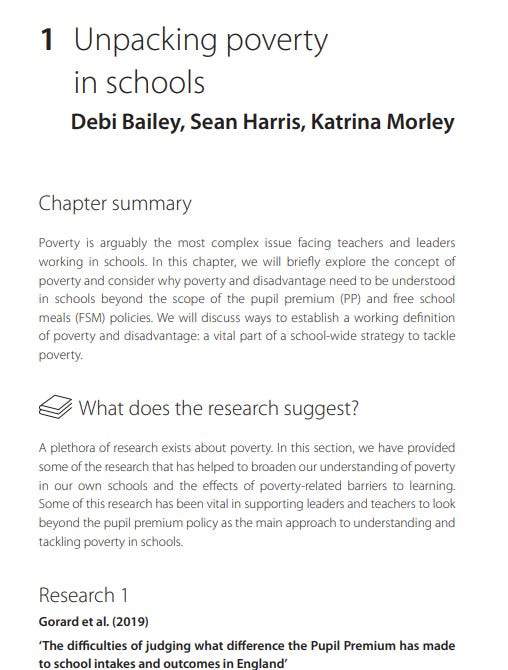
(Source: TPADIS, Bloomsbury; 2025)
Marc Rowland has eloquently argued that the narrative around low-income families often relies on stereotypes. This can lead to misconceptions, making it harder to understand the real, varied needs of these students.
A good case in point is NEAT Academies Trust in Newcastle upon Tyne, where CEO Debi Bailey and team use innovative tools, like the Pupil Attitudes to Self and School (PASS) assessment, to identify students who may be ‘managing but not thriving’. These are the students who seem to be coping at primary school but struggle as they transition to secondary school, where the challenges become more pronounced and individualised support is harder to come by.
In TPADIS, we feature the work of NEAT as a case study and I’m delighted to share that Debi co-authored the opening chapter,
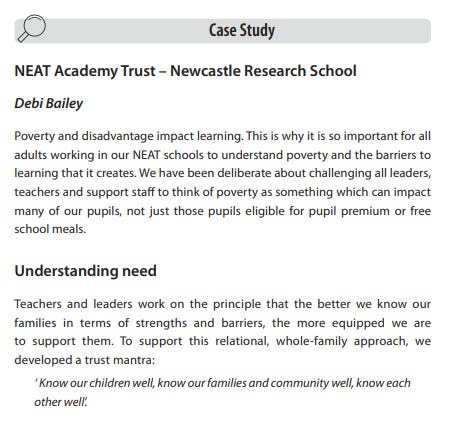
(Source: TPADIS, Bloomsbury; 2025)
Deep social listening.
One of the key elements of understanding and addressing educational inequality is listening — really listening — to the children and communities we serve.
At Tees Valley Education, we believe that a commitment to deep social justice needs deep social listening. We cannot simply make assumptions about need.
This principle lies at the heart of my PhD research with Teesside University and my wider work too. As an aside, here’s some additional things I’ve learned on the way.
As we continue to explore these issues, I encourage you to take a look at how children at Pennyman Primary Academy worked with local businesses and school leaders to provide equitable access to reading in Middlesbrough. It’s a powerful example of how children can become courageous leaders of change within their communities.
I could tell you how many books they managed to raise; I could share with you the ways in which children have felt empowered by collective and community agency. But this doesn’t give you the impact that we know the project had.
Measure what matters.
If we focus only on the wrong metrics, we risk missing the real picture — or worse, serving up an undercooked solution.
If we fail to properly measure, like my botched cookie recipe, we might end up with far fewer cookies than we hoped for.

Further links and resources
Campbell, Cooper & Fowler: Who has been registered for free school meals and pupil premium in the National Pupil Database, Education Policy Institute, 2025
Cribb et al: The policy menu for school lunches: options and trade-offs in expanding free school meals in England, Institute for Fiscal Studies, 2023
Elliot Major & Briant: Equity in Education: Levelling the learning playing field, John Catt Educational, 2023.
Gorard: The impact of pupil premium funding on educational outcomes: A complex issue, British Educational Research Journal (48,1), 2022
Harris: Doorstep disadvantage: Beyond the Pupil Premium, SecEd, 2021
Harris: Challenging the myths of poverty in school, SecEd, 2024.
Harris: Ten questions to ask about poverty and hardship in schools: How Poverty Proofing can help to answer them, Substack Blog, 2024.
Harris & Morley. Tackling Poverty and Disadvantage in Schools; Bloomsbury. 2025.
Hilary: We can’t close the disadvantage gap if we don’t know what drives it, Schools Week, 2025:
Rowland: Addressing educational disadvantage in schools and colleges: The Essex Way, Unity Research School & Essex County Council, 2021.
Sharp et al: Measuring pupil disadvantage: The case for change, NFER, 2023: